
What are logs?
A log is a diary kept by your server. Each line records one event with a time. There are two main types:
- Access logs list every visit. They show who asked for which page and whether it worked.
- Error logs list problems. They help you find why a page broke.
WordPress can also keep its own error log, called the debug log.
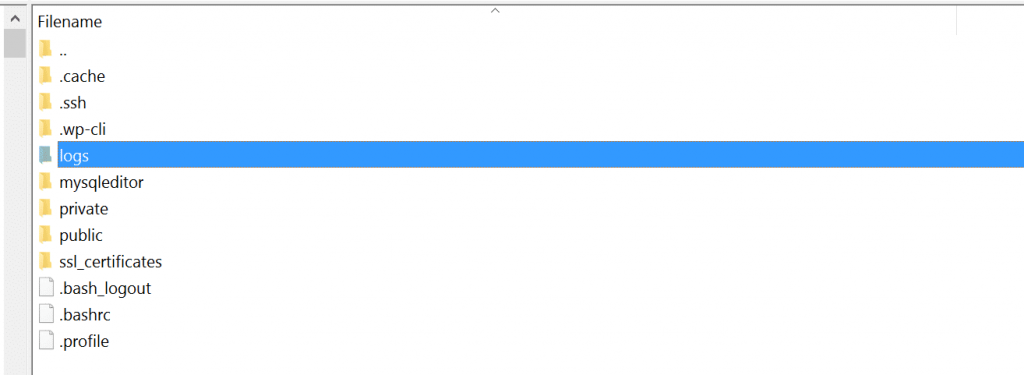
Way 1: Your control panel
Many control panels have log tools. Look for names like Raw Access, Metrics or Errors. The names vary by panel.
- Log in to the client area.
- Open your hosting service and go to your control panel.
- Look for Errors to see the latest error lines.
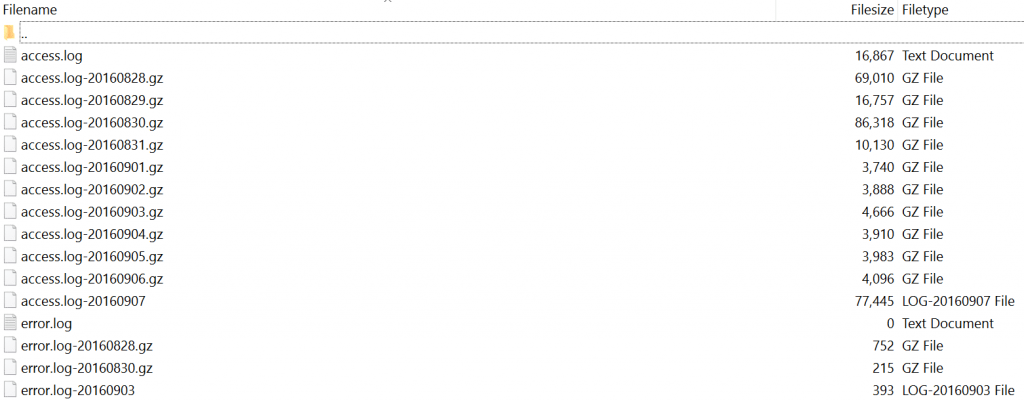
- Look for Raw Access or a similar page to download access logs.
- Open the downloaded file with a text editor. Some files are compressed, so unzip them first.
Way 2: The WordPress debug log
wp-config.php before you edit it.- Open File Manager and edit
wp-config.php.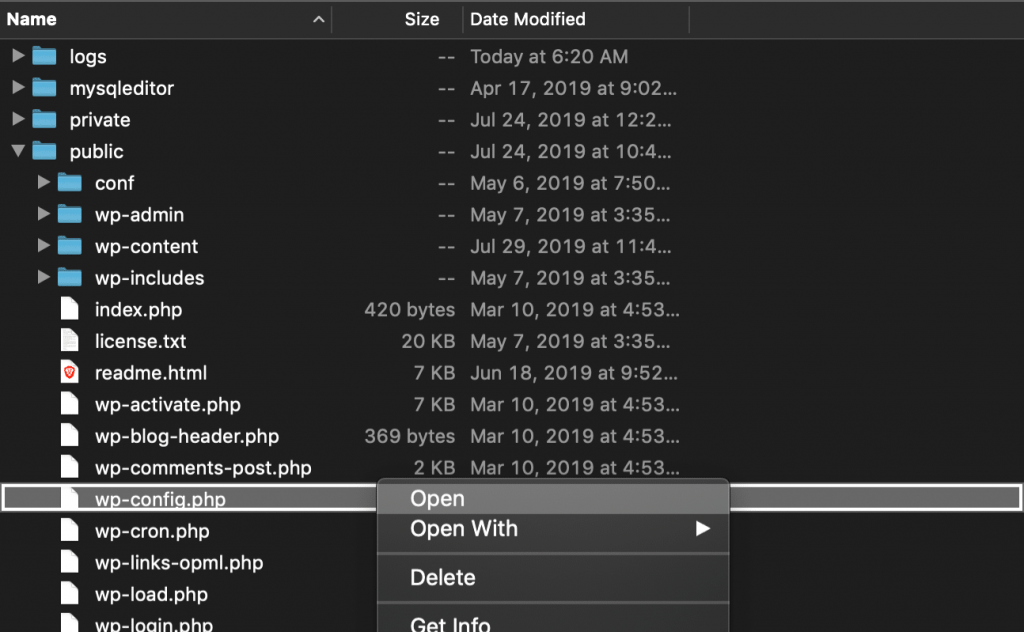
- Find
WP_DEBUGand replace it with the lines below.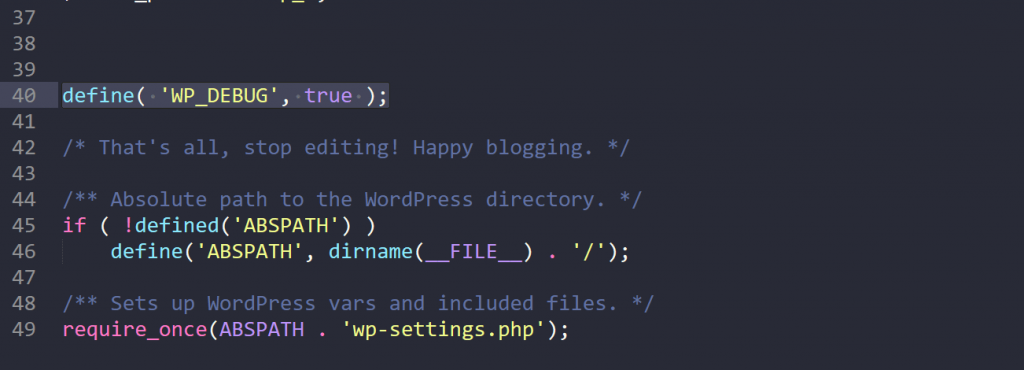
- Save the file.
- Visit the page that has the problem.
- Open
wp-content/debug.login File Manager.
define( 'WP_DEBUG', true );
define( 'WP_DEBUG_LOG', true );
define( 'WP_DEBUG_DISPLAY', false );
These lines turn on debugging, save errors to a file, and keep them hidden from visitors. Turn debugging off again when you finish. The log can grow large and may show private details.
Way 3: SSH
With SSH you can read logs from the command line. SSH is a safe way to type commands on your server. The log paths differ between servers, so check with Hostvento support. To see the end of a file, use:
tail -n 50 wp-content/debug.logThis shows the last 50 lines of the debug log.
tail -f wp-content/debug.logThis keeps the file open and prints new lines as they appear. Press Ctrl+C to stop.
How to read a line
An error line usually has a time, the type (such as Fatal error or Warning), a message and a file path. The file path tells you which plugin or theme caused it. A fatal error stops the page. A warning is smaller and often does not break the page.
Quick recap
- Access logs show visits. Error logs show problems.
- Find them in your control panel.
- Turn on
WP_DEBUG_LOGfor a WordPress log.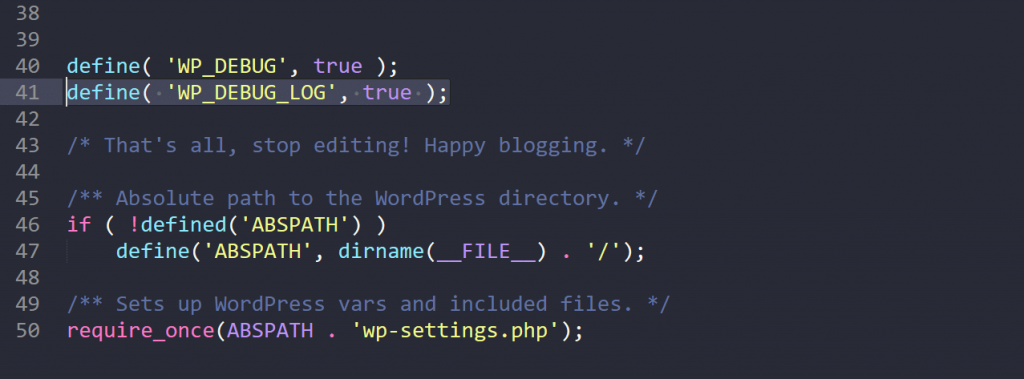
- The file path in an error names the cause.