
Flash Sale:75% Off Hosting + Free DomainEnds in13h47m14sView Plans
Hostvento logoHostvento

Monitor CPU, Memory and Disk on a Windows Server

This guide shows you easy ways to watch how busy your Windows server is. It helps you spot slow-downs early.

Windows Hosting2 min read13 steps26 screenshots

What are system resources?

A server has limited parts that do the work. The CPU is the brain that thinks. Memory (RAM) is the desk space for work in progress. The disk is the cupboard that stores files. The network is the road for data. If one of them is full, your websites become slow. Watching them tells you when something is wrong.

Method 1: Task Manager

  1. Right-click the taskbar and choose Task Manager. Or press Ctrl + Shift + Esc.
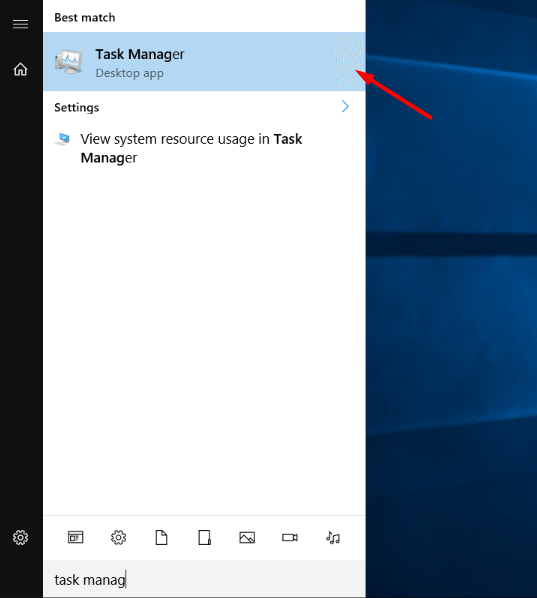
    Screenshot: Right-click the taskbar and choose Task Manager . Or press Ctrl + Shift + Esc .
  2. Click More details if you see a small window.
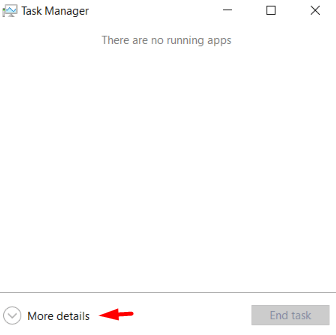
    Screenshot: Click More details if you see a small window.
  3. Open the Processes tab. Click the CPU, Memory or Disk column title to sort by use.
    Screenshot: Open the Processes tab. Click the CPU , Memory or Disk column title to sort by use.
    Screenshot: Open the Processes tab. Click the CPU , Memory or Disk column title to sort by use.
    Screenshot: Open the Processes tab. Click the CPU , Memory or Disk column title to sort by use.
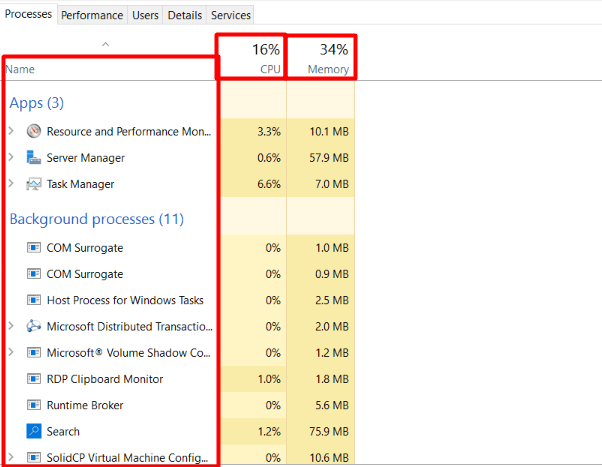
    Screenshot: Open the Processes tab. Click the CPU , Memory or Disk column title to sort by use.
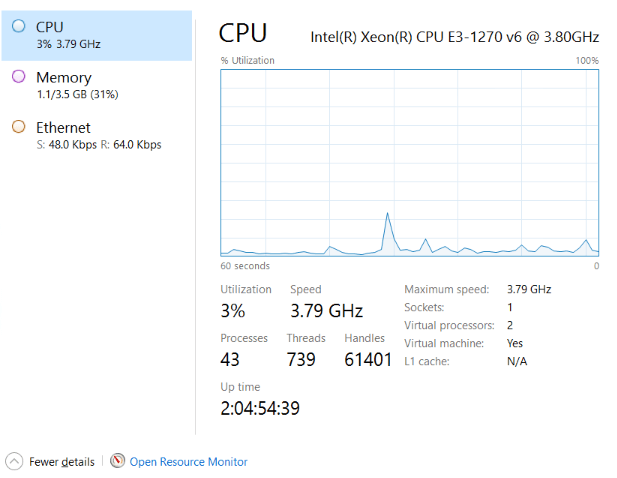
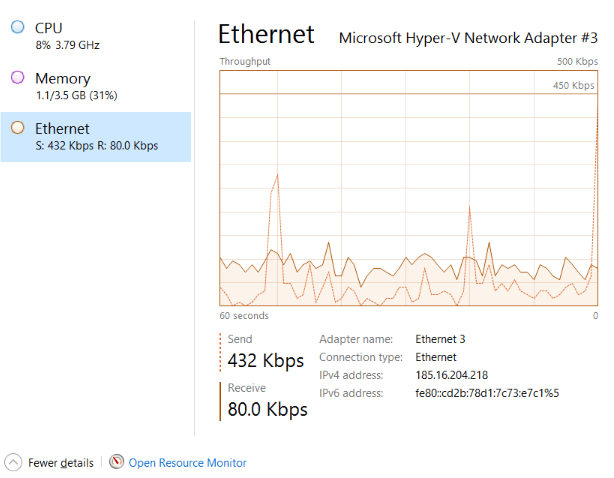
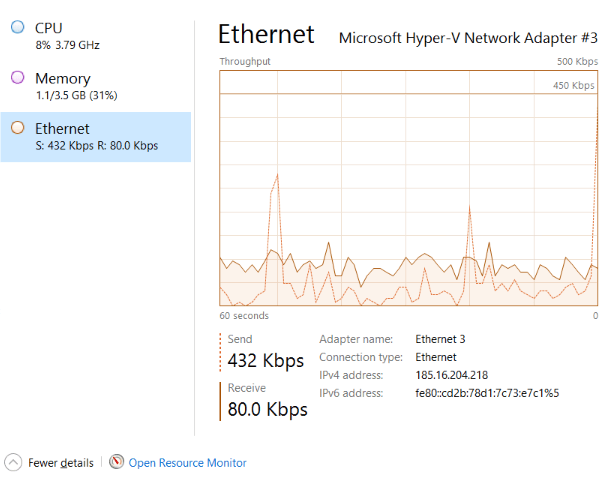
  4. Open the Performance tab to see live graphs for CPU, memory, disk and network.

A CPU that stays near 100 percent for a long time is a warning sign. So is memory that is almost full.

Method 2: Resource Monitor

  1. In Task Manager, open the Performance tab.
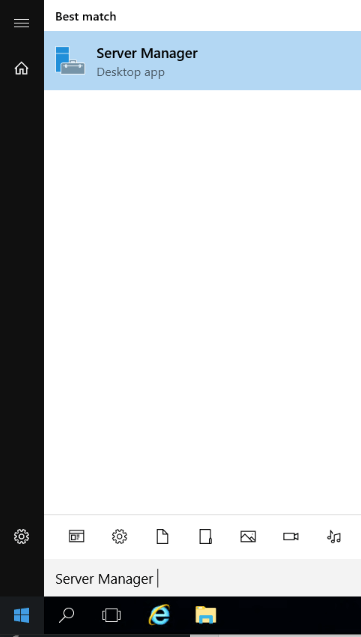
    Screenshot: In Task Manager, open the Performance tab.
  2. Click Open Resource Monitor at the bottom.
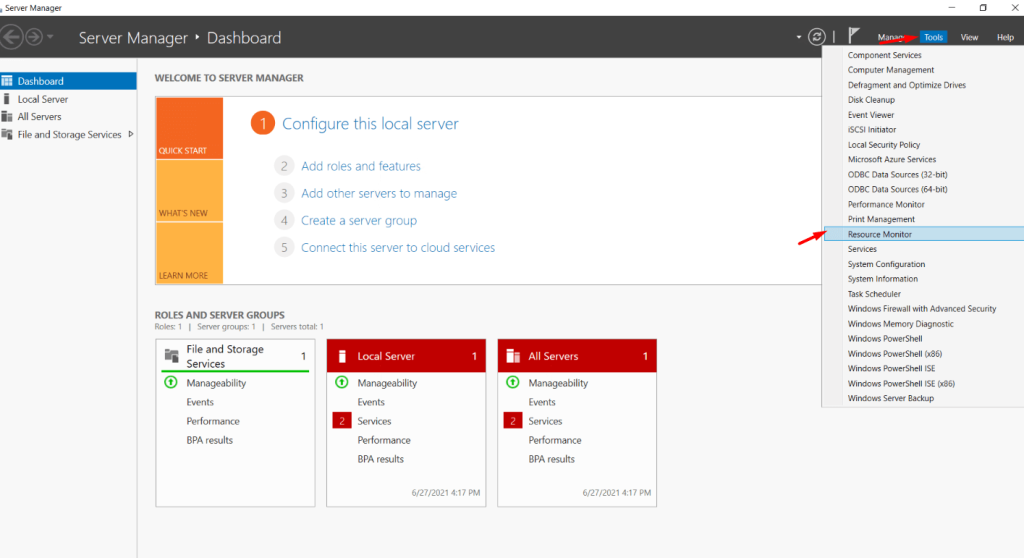
    Screenshot: Click Open Resource Monitor at the bottom.
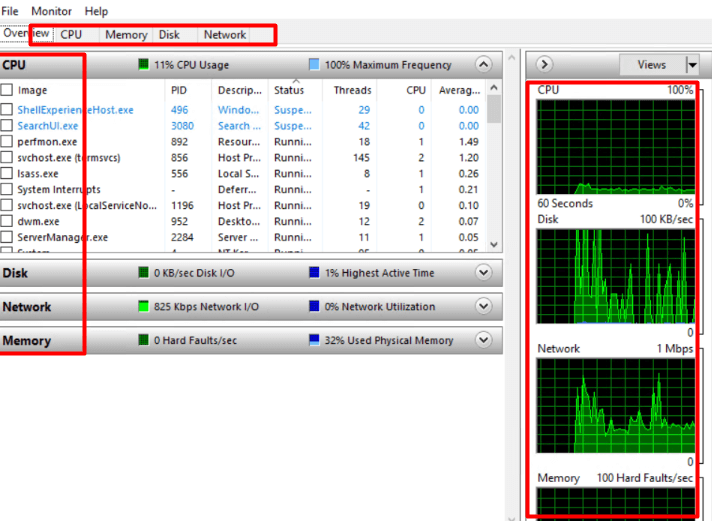
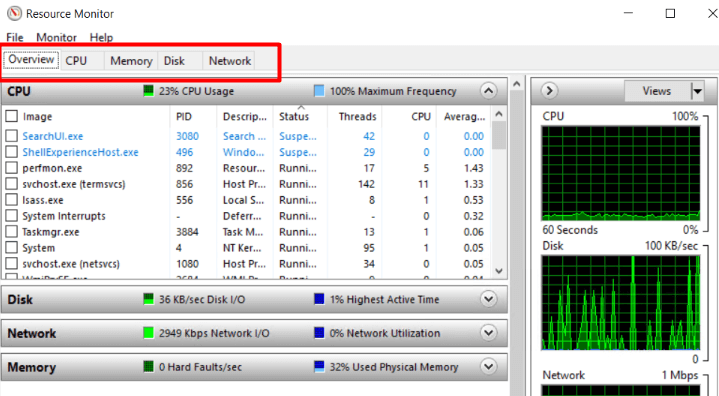
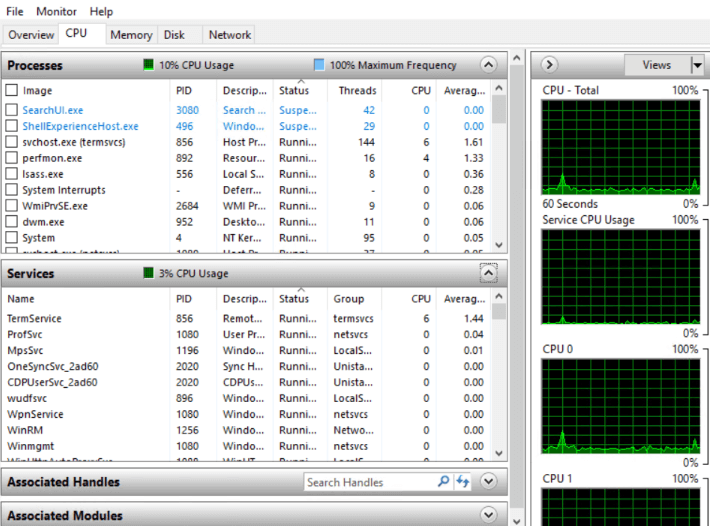
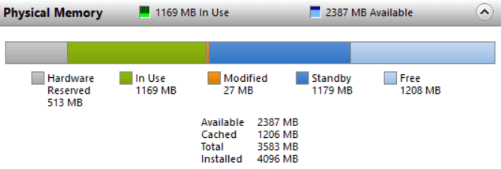
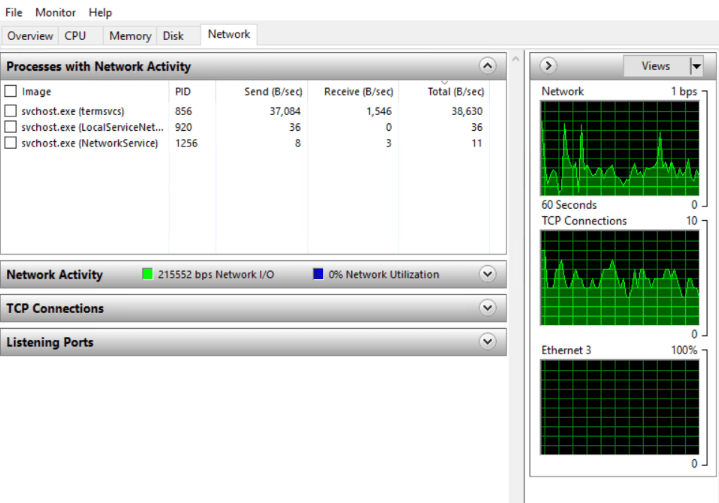
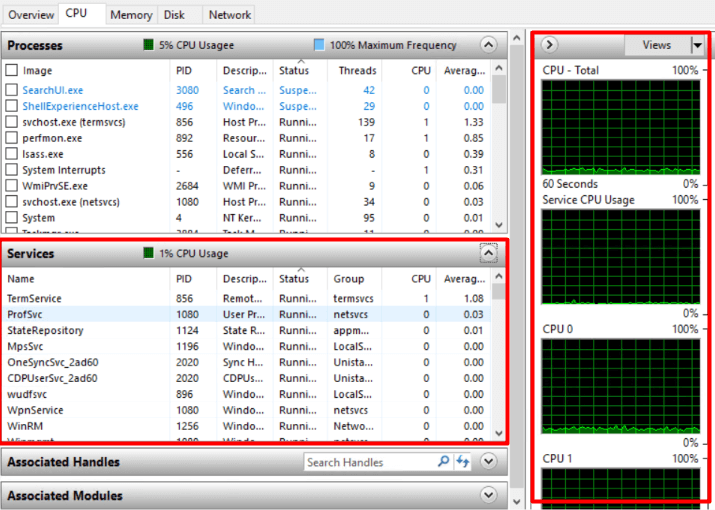
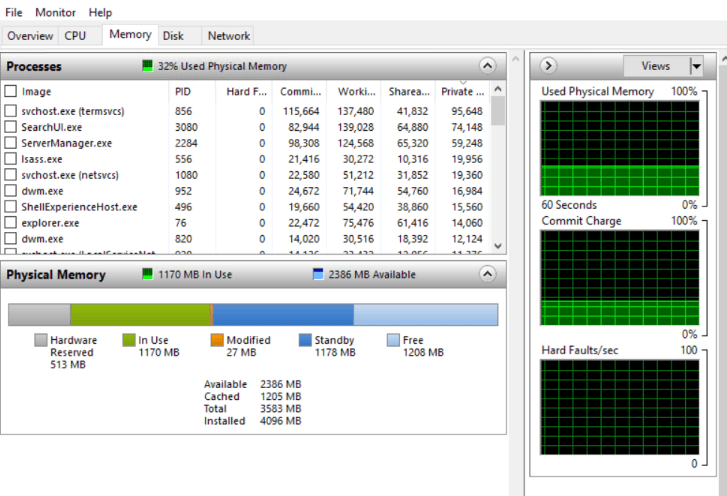
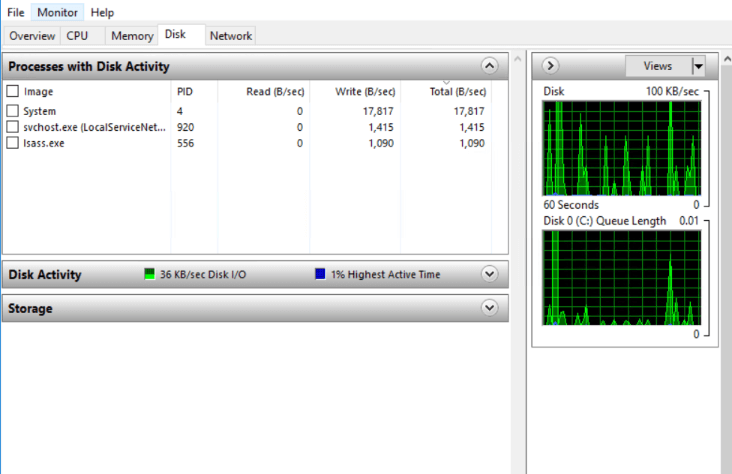
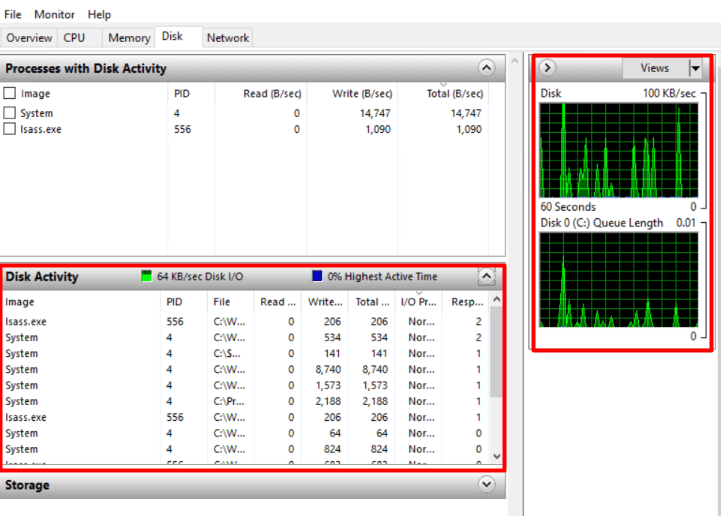
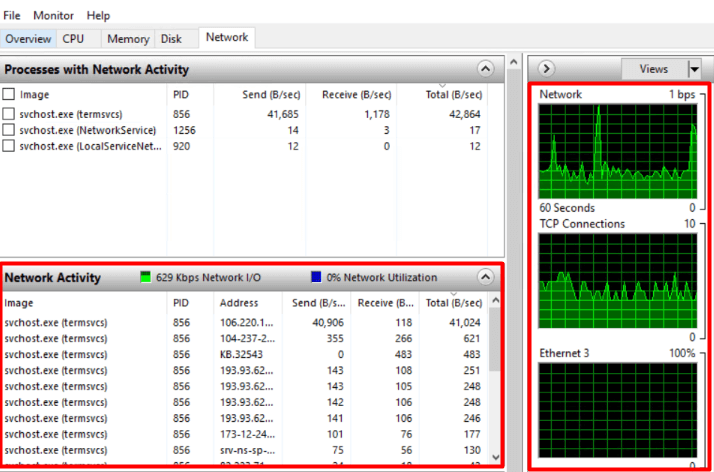
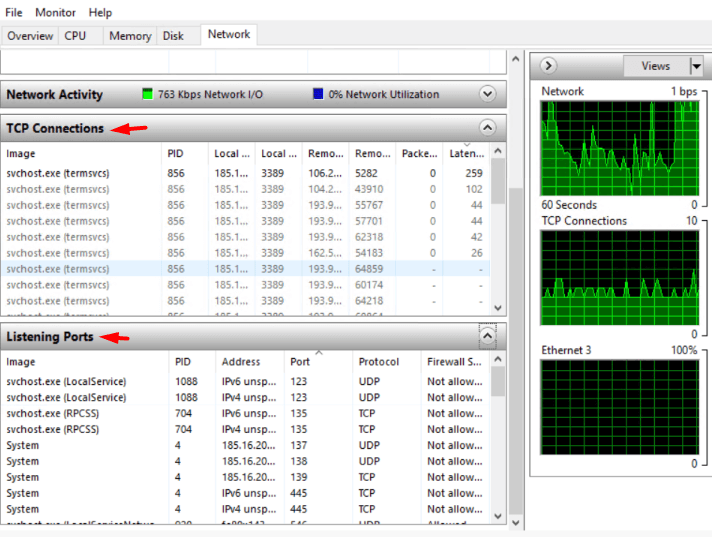
  3. Use the tabs CPU, Memory, Disk and Network.
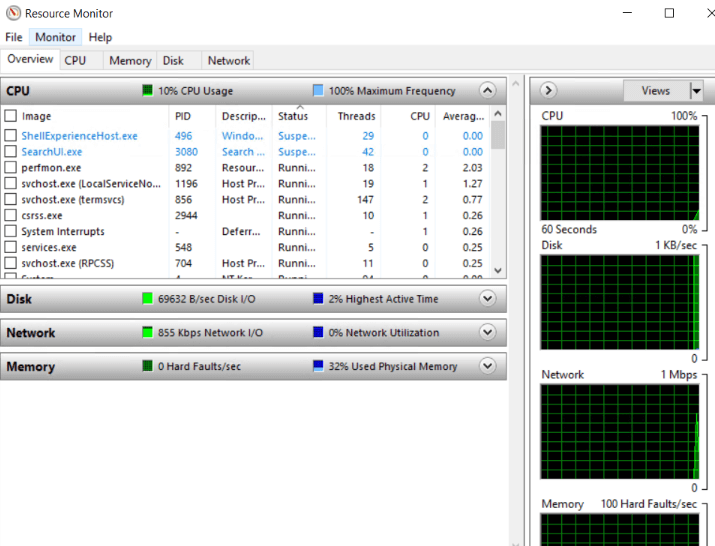
    Screenshot: Use the tabs CPU , Memory , Disk and Network .
    Screenshot: Use the tabs CPU , Memory , Disk and Network .
    Screenshot: Use the tabs CPU , Memory , Disk and Network .
    Screenshot: Use the tabs CPU , Memory , Disk and Network .
  4. Each tab lists which program uses the most.

Method 3: Performance Monitor

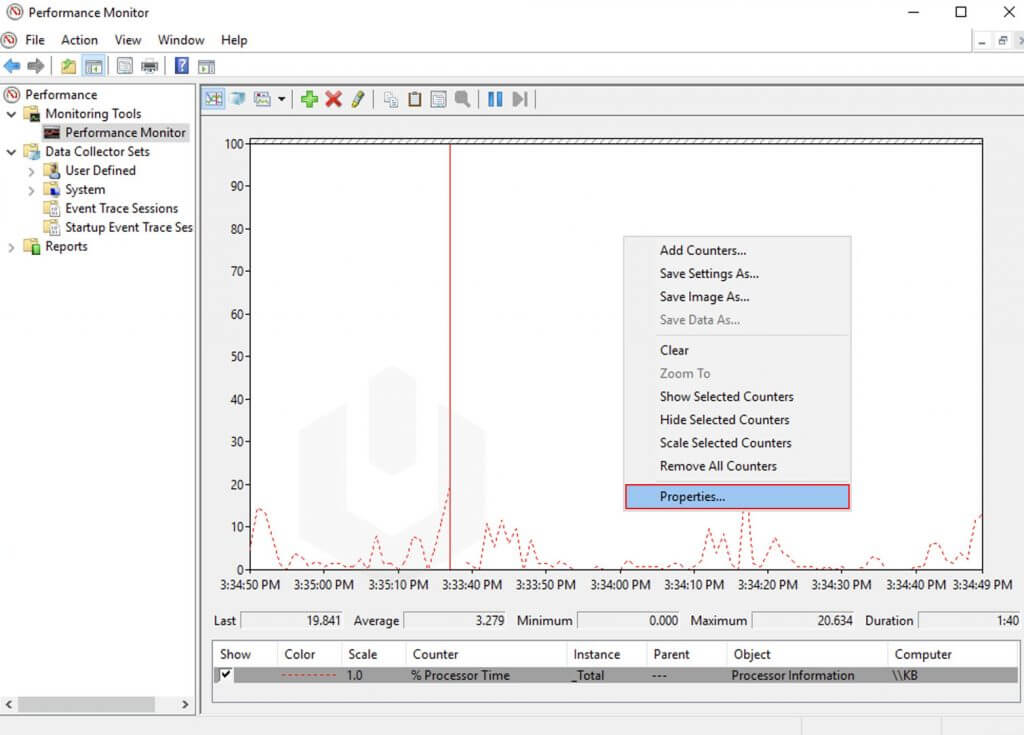
Performance Monitor keeps a record over time using counters. A counter is a number that measures one thing.

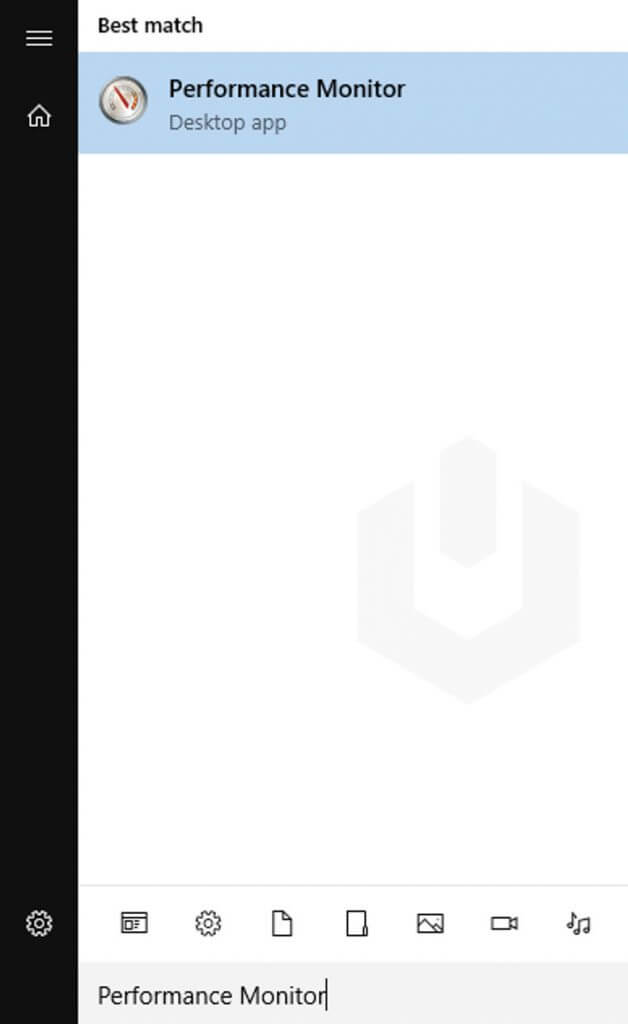
  1. Press Windows + R, type perfmon and press Enter.
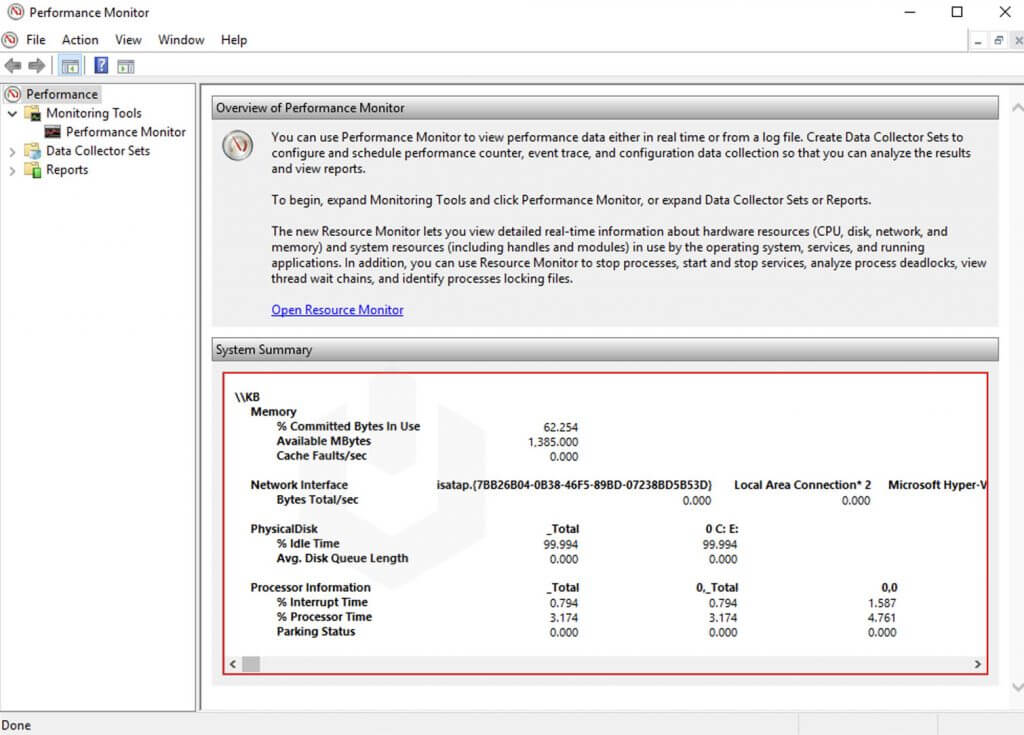
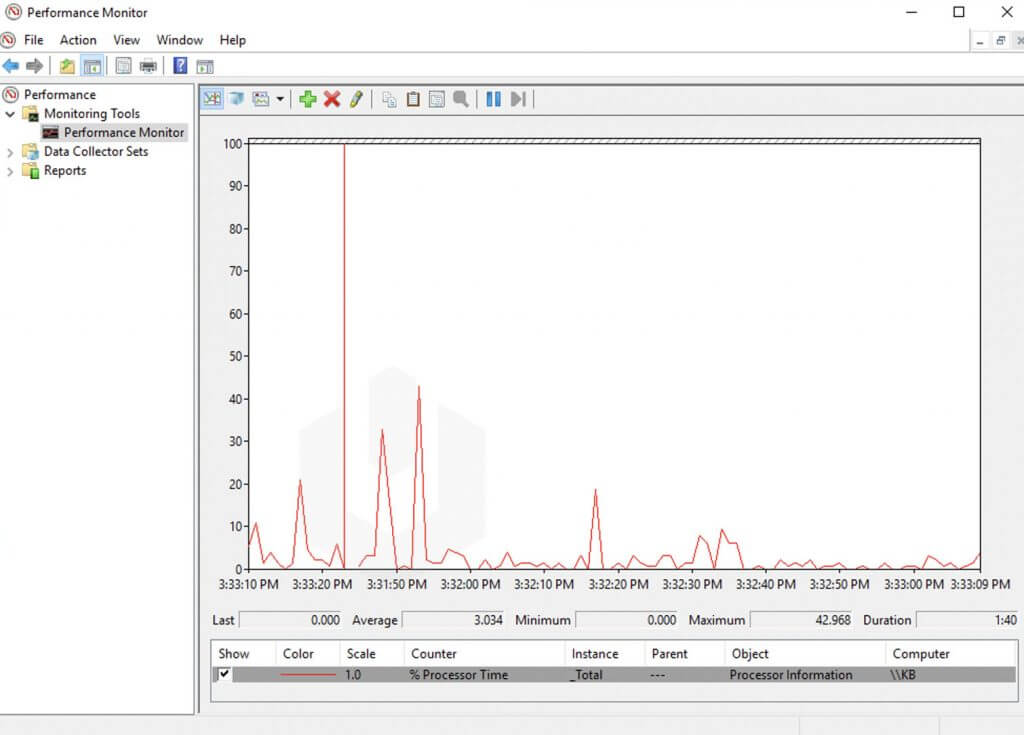
  2. Click Performance Monitor in the left tree.
    Screenshot: Click Performance Monitor in the left tree.
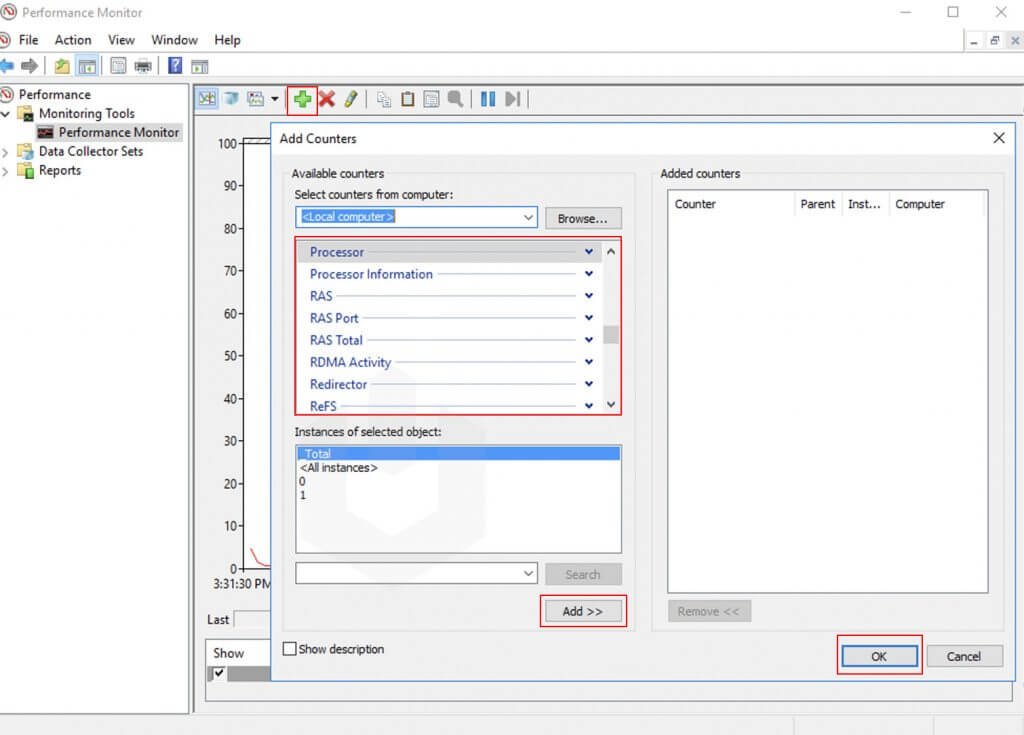
  3. Click the green plus sign.
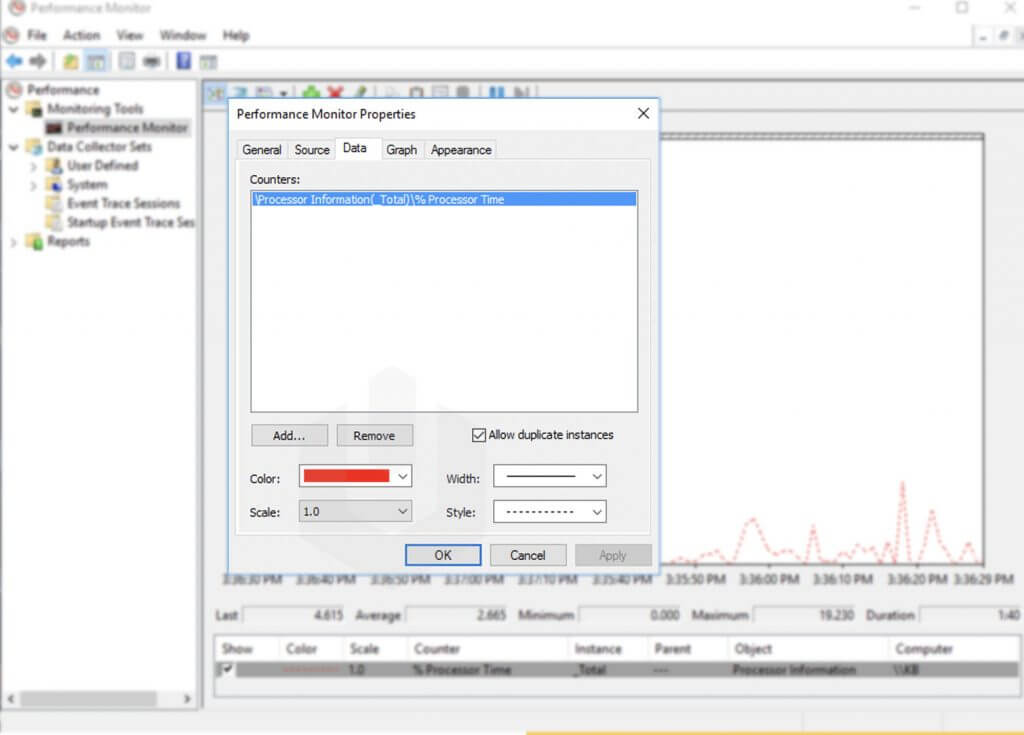
  4. Add counters such as Processor, % Processor Time and Memory, Available MBytes.
    Screenshot: Add counters such as Processor, % Processor Time and Memory, Available MBytes .
    Screenshot: Add counters such as Processor, % Processor Time and Memory, Available MBytes .
  5. Click OK to see the graph.

To save a record, open Data Collector Sets, right-click User Defined, and choose New. Follow the wizard.

Method 4: Command line

tasklist
systeminfo
typeperf "\Processor(_Total)\% Processor Time"

The first line lists running programs. The second shows system details. The third prints the CPU use over and over. Press Ctrl + C to stop it.
Screenshot: The first line lists running programs. The second shows system details. The third prints t

What to do when usage is high

  • Find the program using the most. Stop it only if you know it is safe.
  • Restart a stuck website's application pool in IIS.
    Screenshot: Restart a stuck website's application pool in IIS.
    Screenshot: Restart a stuck website's application pool in IIS.
  • Free disk space by removing old logs and files. Take a backup first.
  • Ask Hostvento support if you may need a bigger plan.
Tip: Look at your server on a normal day. Then you know what "normal" looks like.

Quick recap

  • Watch CPU, memory, disk and network.
  • Task Manager shows a quick view.
  • Resource Monitor and Performance Monitor give detail.
    Screenshot: Resource Monitor and Performance Monitor give detail.
    Screenshot: Resource Monitor and Performance Monitor give detail.
    Screenshot: Resource Monitor and Performance Monitor give detail.
    Screenshot: Resource Monitor and Performance Monitor give detail.
    Screenshot: Resource Monitor and Performance Monitor give detail.
    Screenshot: Resource Monitor and Performance Monitor give detail.
  • Act early when numbers stay high.